Analyzing Your Videos
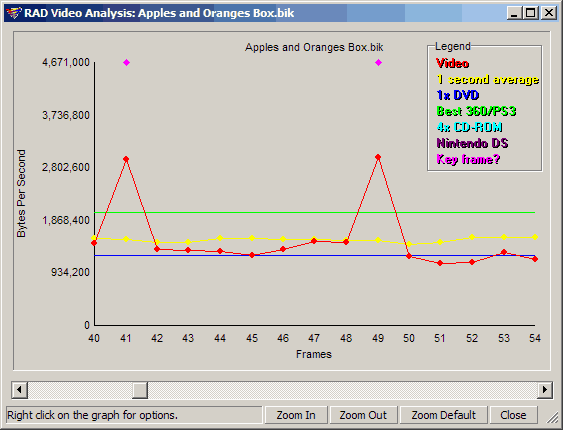
The "Analyze" button is one of the most handy features in the RAD Video Tools. Use this button to check general bandwidth use. The Analyze window can tell you a bunch about a Bink or Smacker file without even having to play it. It displays a visual representation of the video file's data-rate. Here is an example of the Analysis window from a Bink file:

The graph has four lines: the green line is the best quality rate that a PS3 or Xbox 360 can play, the blue line is the data rate off a 1x DVD drive, the red line is the actual data-rate of the Bink file, and the yellow line is a one-second data-rate average.
The video's frame to frame data-rate can spike above the device data rate without too much trouble, but the one-second average should stay close to your target data-rate! If the "one-second-average" goes above your target data rate, then you're very likely to have skipped frames. If the video data-rate is way below the target data-rate, then you can improve the quality just by compressing it again.
So, the analysis option can not only tell you when you exceeded your target data-rate, but it can also tell you when you've over-compressed. If the analysis shows that you are well under your data rate, then you can go back and re-compress for better quality. I find the analysis option so handy that I now automatically check out my videos after every compression. That way I know I'm always getting the best possible quality for my target.
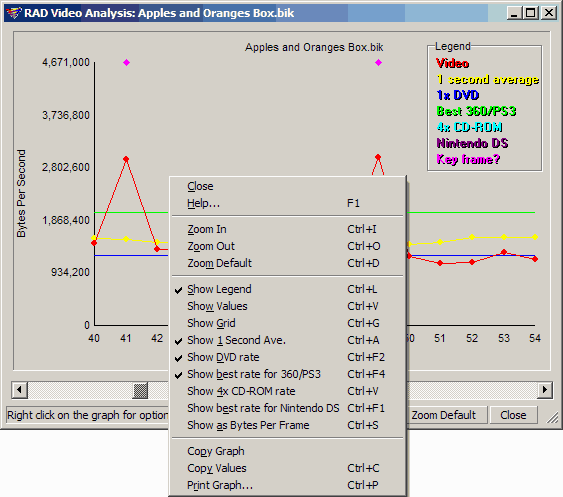
The analysis window has many other options that can be accessed by right-clicking on the graph. Right-clicking on the graph will present the following list of options:

Close: simply closes the analysis window.
Help: shows this help page.
Zoom: allows you to see the big picture or the really little picture.
Show Legend: hides and shows the legend in the upper right corner.
Show Values: will display the value of each point on the graph (this is really only useful if you're zoomed in a bit).
Show Grid: controls the grid visibility.
Show 1 Second Average, Show DVD, Show best for 360/PS3, and Show 4x CD, and Show best for Nintendo DS: all control whether the respective data line is shown in the graph.
Show as Bytes per Frame: controls whether you view the values in bytes-per-frame or bytes-per-second.
Copy Graph and Copy Values: copy the analysis data onto the clipboard.
Print Graph: prints the current graph view.