
Telemetry Performance Visualization System
Telemetry 3.5, the new version of Epic's performance visualization system, is shipping now!
Telemetry helps you optimize and understand your application's performance—unlike other traditional profilers it emphasizes performance characteristics in relationship to time and program state, whole-team participation of optimization, always-on profiling, cross-platform support, and ultrafast integration.
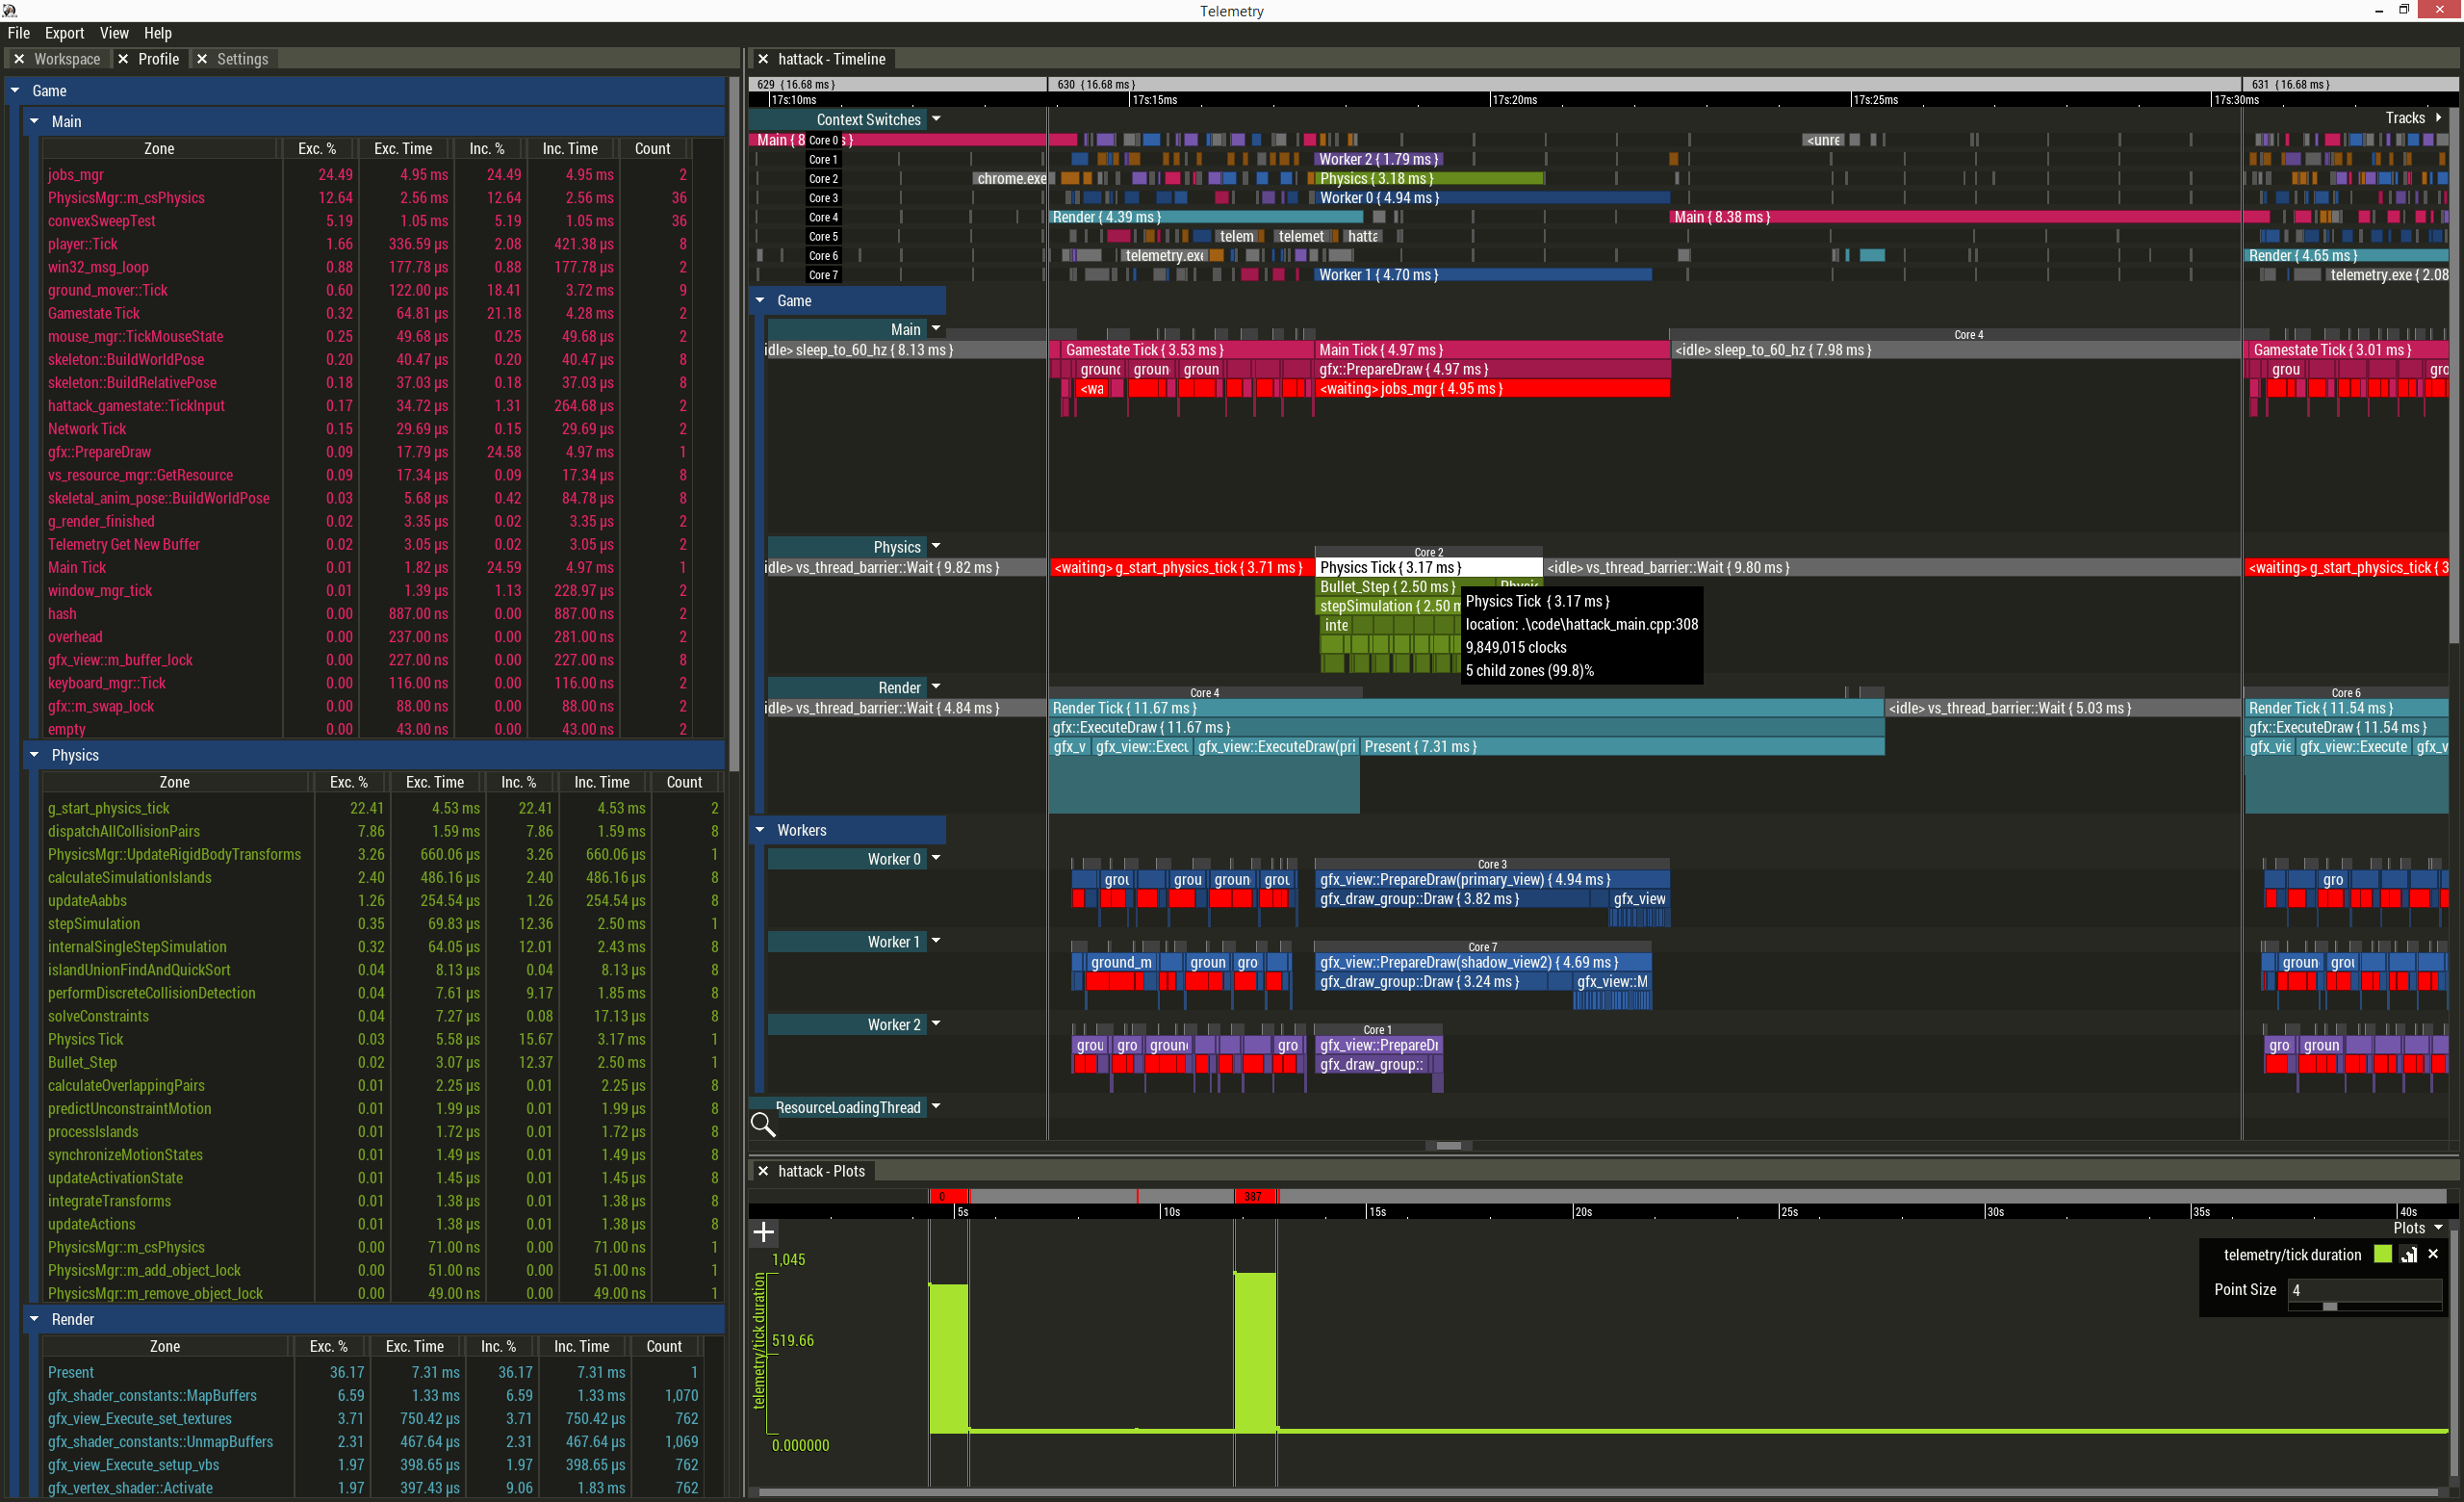
Telemetry is a performance visualizer, so all your performance information is presented graphically—why wade through rows of numbers trying to find patterns when Telemetry can show you those patterns?!
In addition to this Web page you can learn more about Telemetry by: reading what our customers think, checking out Telemetry's features, FAQ, and version history; and following the RAD Twitter feed.
Application State vs. Performance
All good profilers can tell you that something took too long. Hey, RenderScene() took 80ms! While good to know, without any context it's meaningless. Telemetry addresses this by letting you provide vital additional information that helps you make sense of performance data:
- What else was going on in the application?
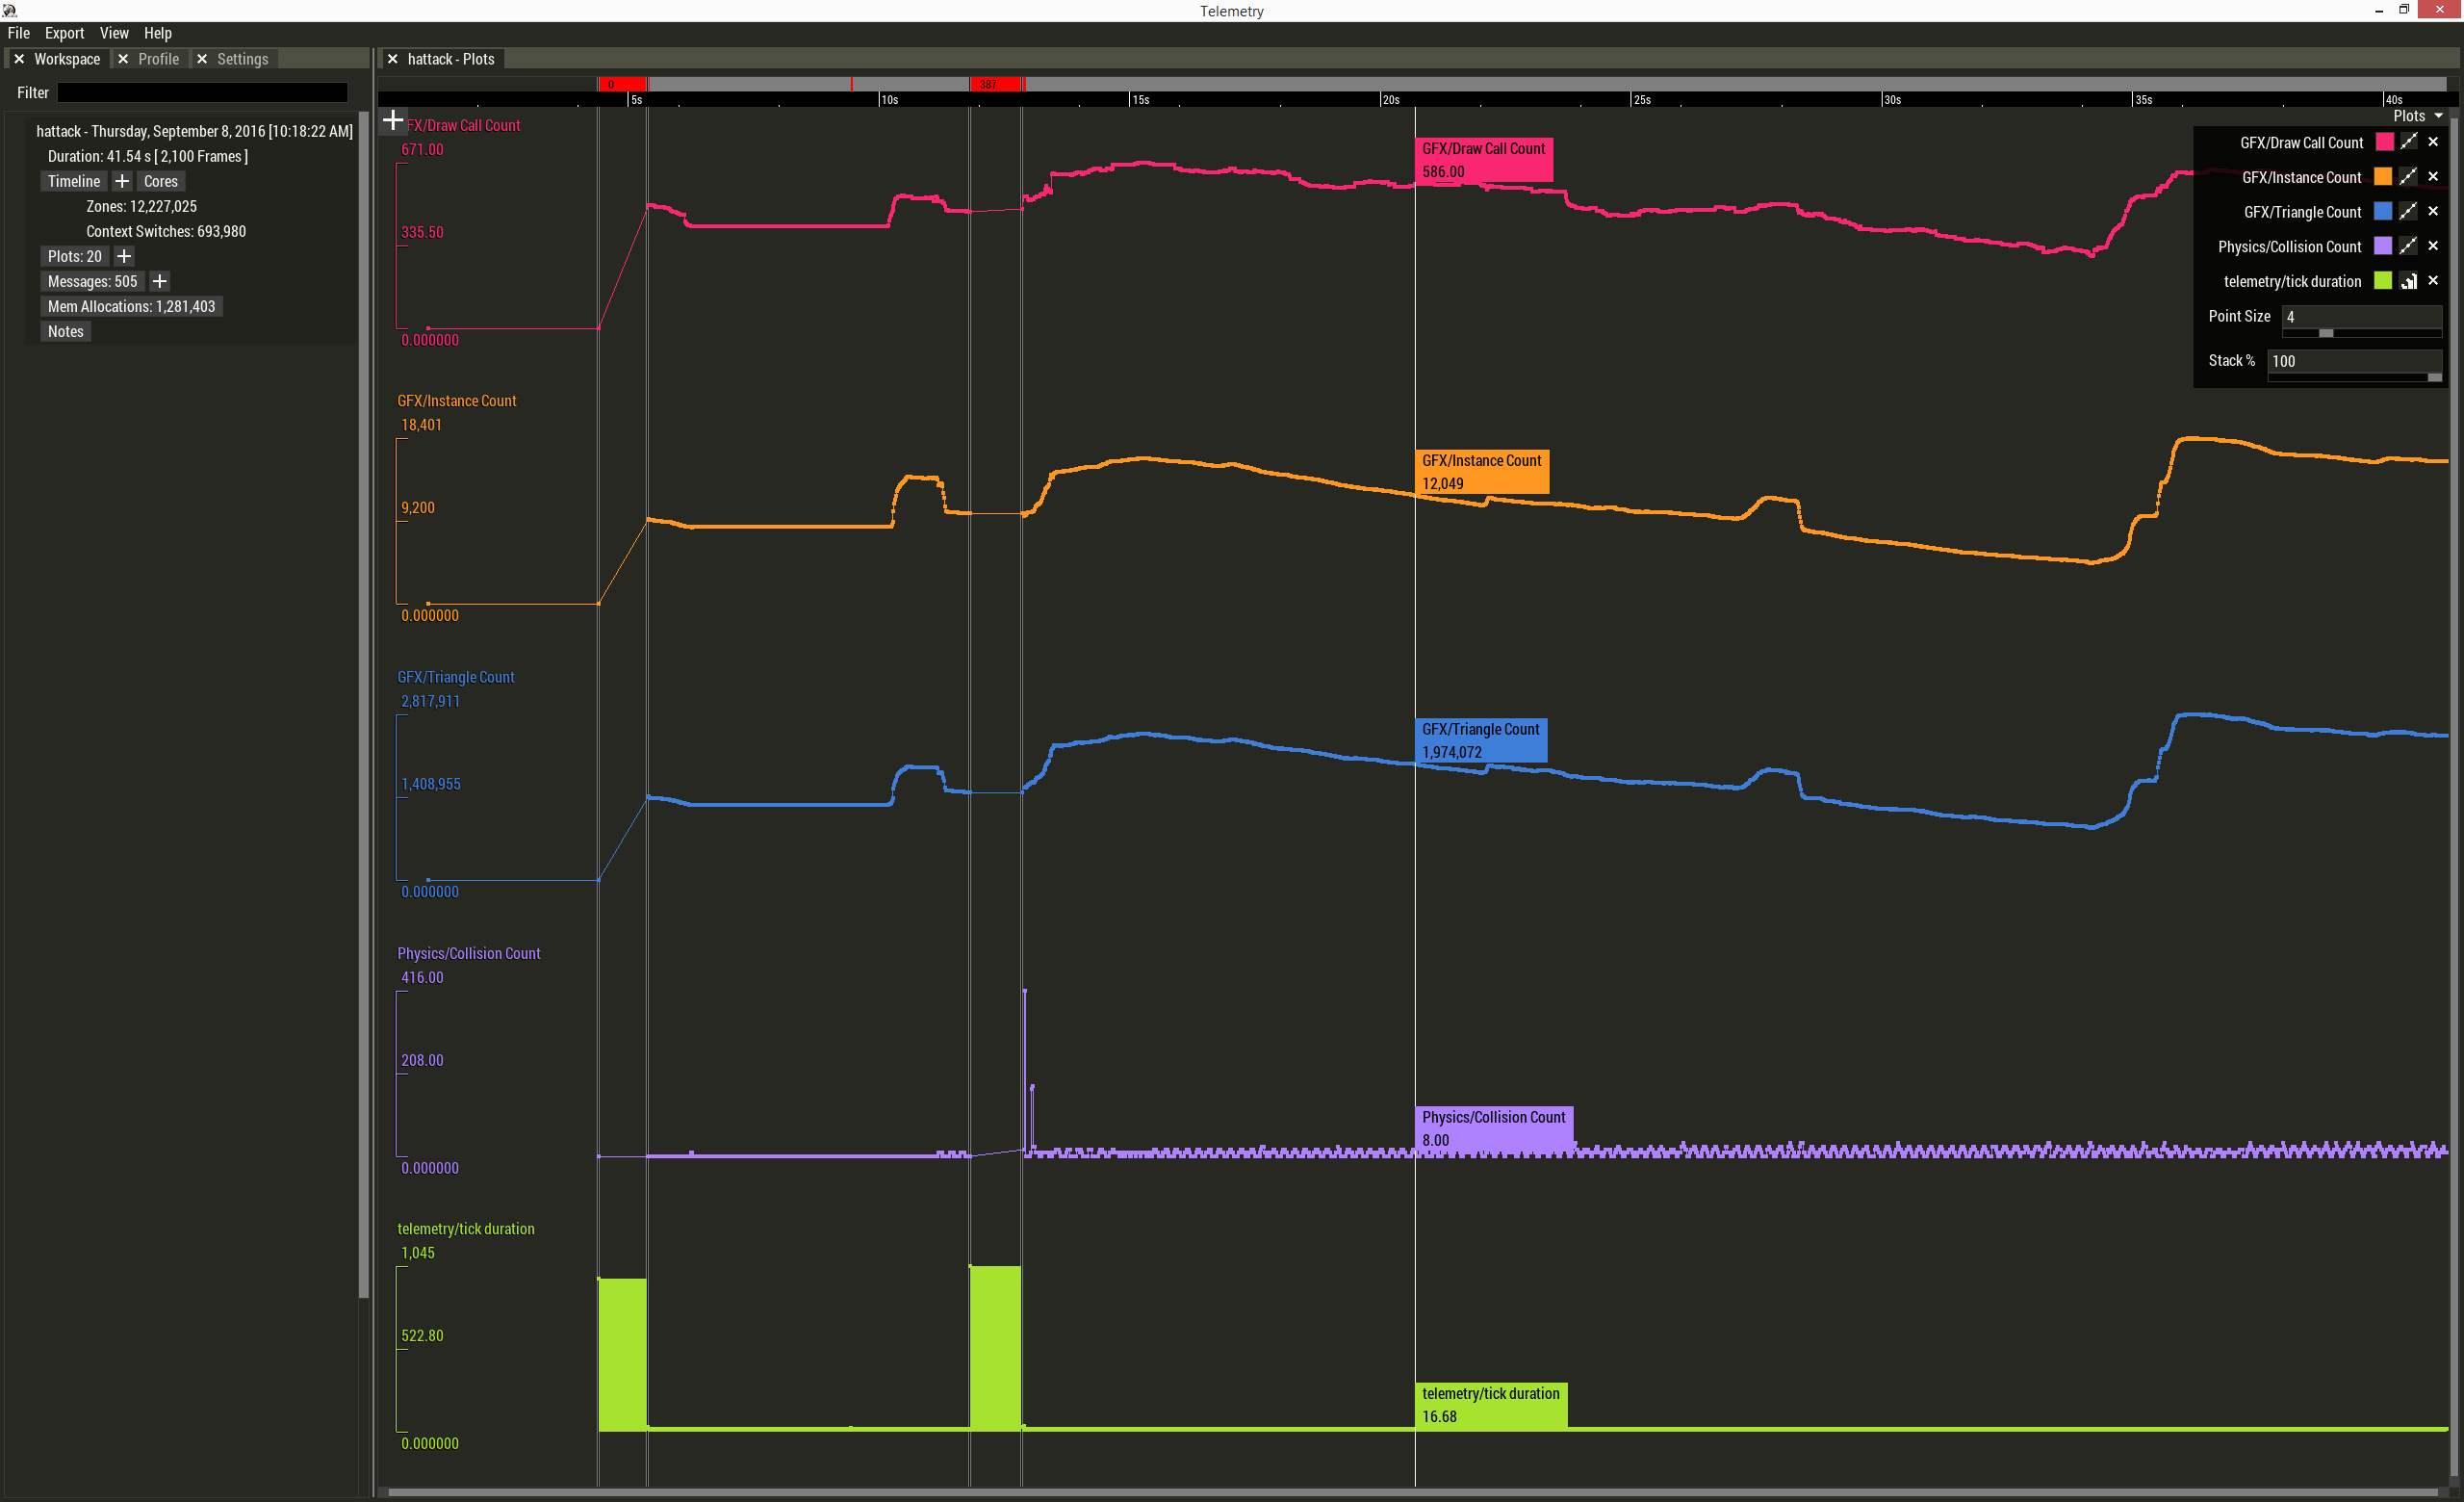
- When your program slows down you need to know what else was going on, not just that you were slow! Visible enemies, simultaneous sounds, texture memory in use, active lights, connected players— this is the kind of information that impacts a game's performance, and with Telemetry you can see relationships between your app's state and performance!
- When did it happen?
- Most profilers tell you that something was slow, but they usually can't tell you when things got slow. Telemetry shows you those spikes in frame time (i.e. hitches and hiccups) so that you can isolate the circumstances of poor performance. When something bad happens is just as important as knowing that it happened at all.

- How are my threads behaving?
- Telemetry shows you the relationship between your own threads: lock contention, stalls, starvation, and idle areas are all presented visually. Now you can see when one thread is interfering with another!
- Why is this thread slow?
- Telemetry has programmer-driven profiling, where you mark up the code for precision profiling, as well as sample-based profiling, where you sample a threads callstack periodically and then organize the results. You can even run both at the same time!
- What else was going on in my system?
- Telemetry offers additional forensic information to help you get to the bottom of performance issues. Telemetry can show you context switches— see when threads migrate between cores (Windows & PS4) and when threads are swapped in and out by the scheduler. On Windows, you can even see when other processes (virus scanners, updaters, music players, chat programs, etc.) preempt your program!
Modern software performance is incredibly complex, and optimization is no longer just about making one function faster. Telemetry tames that complexity and helps you discern patterns within your program's performance profile, which leads to more and better opportunities for optimization at a higher level.
Whole Team Participation
All this high level visualization means that the whole team, not just programmers, can contribute to optimization! Artists, designers, and testers can now correlate state with performance. When too many enemies, lights, AI pathing nodes, sound sources, particles, and so on are causing a dip in performance, Telemetry's visualization makes it glaringly obvious to everyone! Now everyone can work on performance independently— no more dragging a coder to an artist's desk just to point out that the particle spawner is emitting too many particles!
Always On
The best tools are the ones that you actually use, and for this reason Telemetry is designed to be "always on". Shifting gears between "developing" and "optimizing" is disruptive, especially when you have to change build settings and run your software differently.
Telemetry is designed to be available at all times, not just when you're profiling.
Telemetry consumes very little overhead during normal operation, and even less when it's inactive (for example, when it's uninitialized, can't connect to a server, or is missing its DLL). Telemetry gets out of the way when not in use, but is easy to turn on when you need it. No recompilation necessary!
The Telemetry 3 run-time has extremely low overhead, so profiling with Telemetry won't kill your program's performance. Capture masks allow for isolating different sections of your code for profiling. Capture over a million timing zones per second in real-time!
Instrumented Profiling and Sample-Based Profiling
Telemetry 3.5 can profile with precise, high performance programmer-driven instrumentation based profiling, or you can use sample-based profiling. Each have different pros and cons, and Telemetry supports them both - even simultaneously! You can start with sample-based profiling and it will show you where you should add instrumentation. Or, if you have an instrumented build already running, a sample-based profile can show you if your thread has been swapped out, or where the time is being spent within a zone! It's a whole new way of experimenting!
Cross-Platform
In line with the theme of "maximum availability", Telemetry is a cross-platform performance visualization system. The best tools are those that are available when you need them, and Telemetry supports multiple run-time platforms, including: Microsoft Windows, XBOX 360, and XBOX One; Sony PS3, PS4 and PS Vita; Nintendo Switch and Wii-U; Apple MacOS and iOS; Google Android; Google Stadia; Linux (x86, x64, and ARM); and QNX (x86 and ARM), with more on the way! Not only that, but our tools are available for Windows, Apple MacOS X, and Linux (x64). Use one performance visualization system on multiple platforms!
Ultrafast Integration
All of this power is available in minutes— integration often takes less than 15 minutes and requires about a dozen lines of code to get started!
Try Telemetry Now!
Of course, the fastest way to learn about Telemetry is just to email us and set up an evaluation!