
Telemetry Sample Based Profiling
Telemetry has always been a fantastic instrumentation profiler, but the release of Telemetry 3.5 adds a whole new dimension to Telemetry profiling ... sample-based profiling!
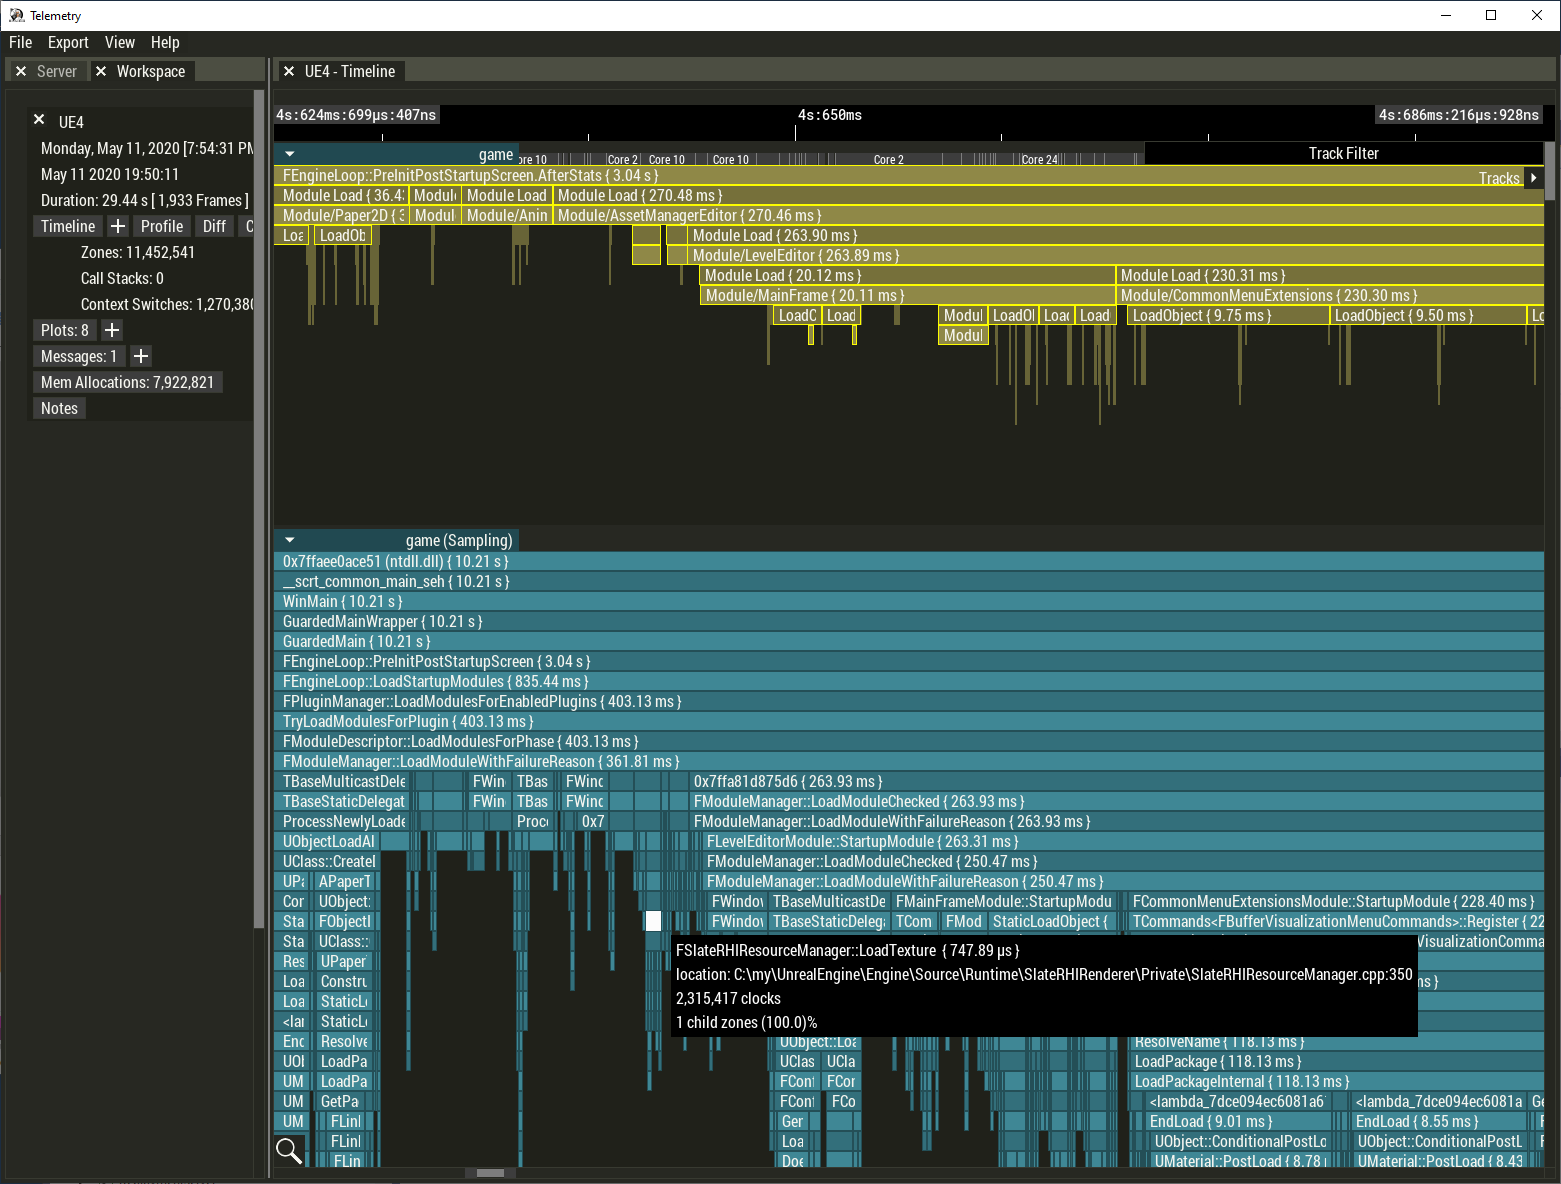
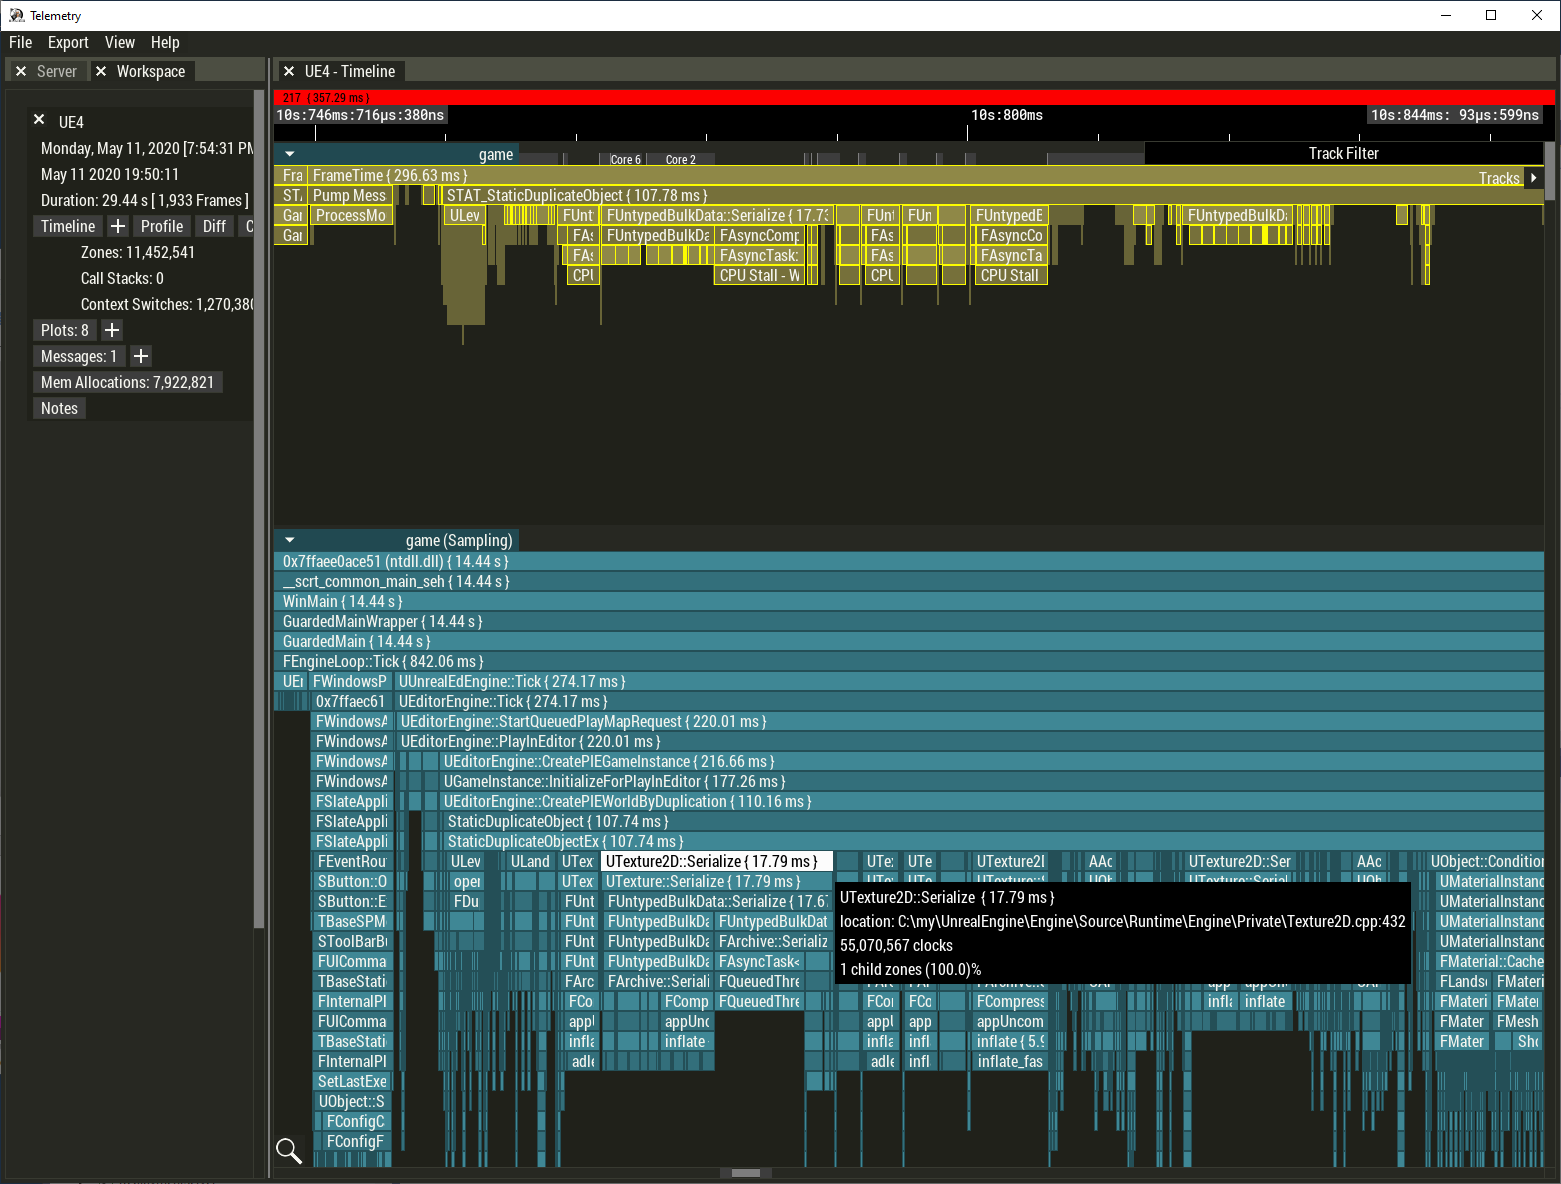
Instrumentation profiling collects timing information based on markers that are placed in code at compile time. These markers are used to record timing information in a hierarchical flame graph, and show where the program spends time. Instrumentation results tend to be very clean, precise, and easy to understand!
Sample-based profiling, on the other hand, collects the program's callstack on a regular time interval and generates the hierarchical flame graph automatically. This allows for profiling code that was not compiled with Telemetry mark-up - both in your code and in third party code! Sample-based profiling allows you to quickly get an overview where a thread is spending most of the time. And this enables you to add instrumentation-based zones more efficiently.
Also, normally, a huge pain with sample based profiling is resolving the symbols for captured callstacks. Telemetry 3.5's sample-based profiling is the first tool to make use of the RAD's new symbol debugging layer, which allows for loading gigabytes of cross-platform symbols almost immediately!
So, what does sampling mean for the RAD Telemetry workflow? First and foremost, it means that customers will be able to profile immediately without the need to mark-up their code and recompile. This will allow for identifying hot spots quickly to know exactly where to focus on a first pass of instrumentation mark-up. It also means that Telemetry can now show with deeper detail exactly what is happening in that long compute zone filled with system calls that cannot be marked-up.
Benefits of Telemetry 3.5's Sampling Profiling:
- Begin profiling immediately without the need to mark-up and recompile
- Use sampling results to know where to add instrumentation mark-up
- Profile third party software that doesn't have Telemetry mark-up
- See in greater details what's happening inside long instrumented zones filled with system calls
- View instrumented and sampling results side by side
- Uses the new RAD debug layer that can load gigabytes of symbols almost instantly
Telemetry Sampling profiling is available for Windows, Xbox and PlayStation.